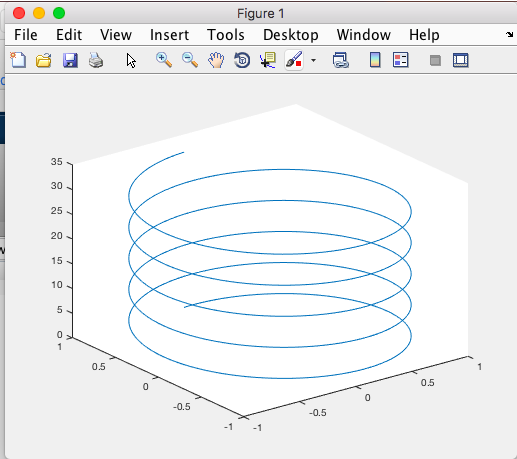
在 command window 中輸入 help plot 之後,在下方有個 plot3,點了之後會出現一些資訊,告訴我們這個指令可以畫 3D 圖形。
plot3
我們可以從資料中找到 exmaple code,並且試著執行:
t = 0:pi/50:10*pi;
plot3(sin(t),cos(t),t);
就會跑出下面這張圖,圖片裡的工具列有一個 Rotate 3D,可以調整圖形的角度。
2D圖形
接著來做 2D 的圖形:
x_coordinate = [1,3,10];
y_coordinate = [2,-4.2,12.3];
plot(x_coordinate, y_coordinate);

//記得座標是用中括弧
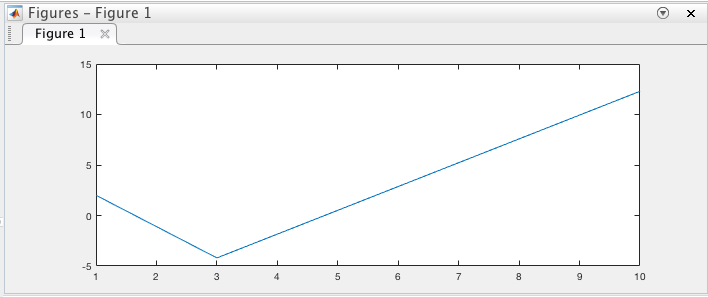
- plot 是一個 input function,裡面的兩個值稱作 input arguments 或稱作 arguments 就好。
- 在 MATLAB 的用詞裡,座標裡有幾個 element 我們稱作 length。
- the number of elements of a vector is called its "length"
- 你可以用下面的語法去查一個變數有幾個 elements
length(x_coordinate)
Plot Function
Plot function 指的是產生圖形的方程式。如果我今天對圖的顯示方式不滿意,我可以查找其他的 plot function 來做調整。
MATLAB 在你輸入方程式時會顯示 hint,這個功能可以幫助你調整:
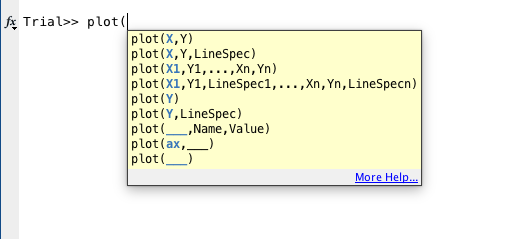 像這個圖,輸入完
 plot ( 之後你會看到 plot(X,Y,LineSpec)
這一項,LineSpec 是指 line-specification argument。
- You use it to tell plot how to plot your points
因此你就可以輸入
plot(x_coordinates, y_coordinates, '*')

//'*' tells plot to put an asterisk at each one of the points instead of a line connecting them.
asterisk 是指 *,quote 內的 character 會被當成 string,字串的顏色是淡紫色(lavender)。
LineSpec
關於 LineSpec 的細節可以輸入 doc plot 去找細節。找到 LineSpec 後,就知道 LineSpec 有許多符號跟顏色可以選。
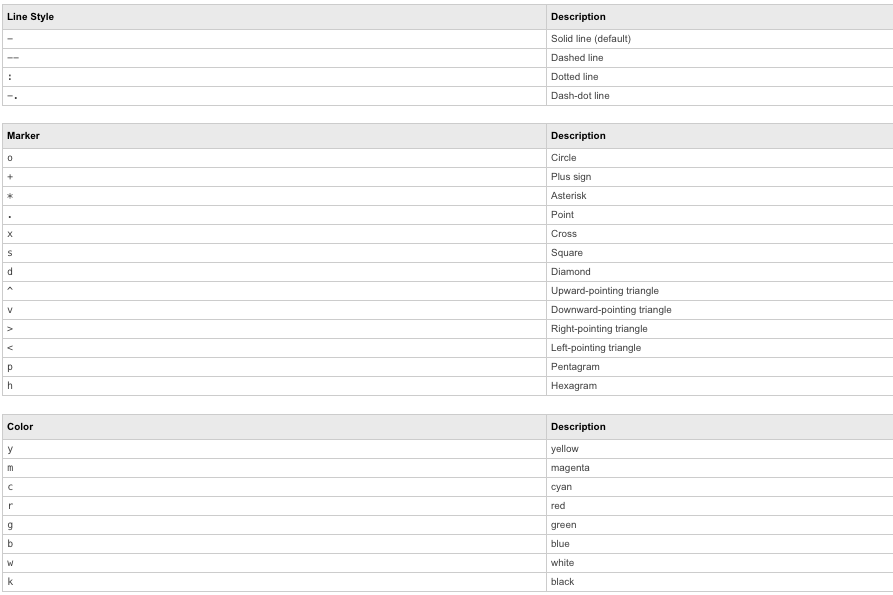
甚至你可以結合兩個 LineSpec,例如
plot(x_coordinate_x, y_corrdinate, rs)

// rs 代表 red square,這樣一來那些座標都會用紅色正方形的方式呈現。
grid on
輸入 grid on 背景就會出現 grid
命名 x,y 軸和標題
輸入
xlabel('橫坐標名稱')
ylabel('縱座標名稱')
title('座標圖')
設定 x軸和 y軸的長度
axis([0,12,-10,20])
// 第一個數字代表 x 軸的下限,第二個數字代表 x 軸的上限。第三個數字代表 y 軸的下限,第四個數字代表 y 軸的上限。
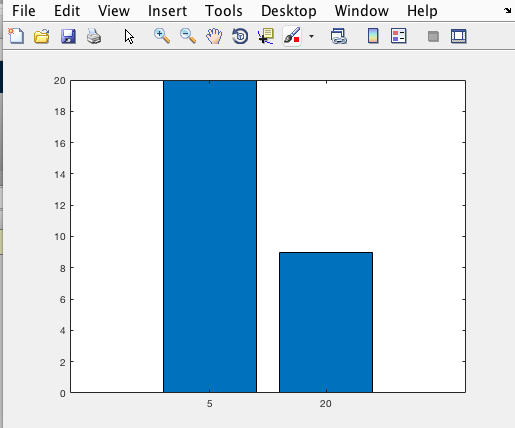
柱狀圖(bar graph)
bar(x_coordinate, y_coordinate);
圓餅圖(pie graph)
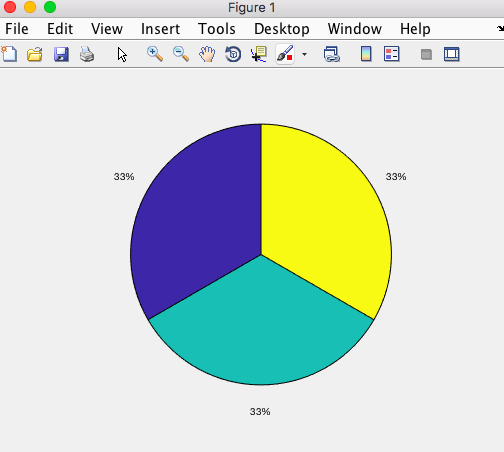
輸入一個陣列,圓餅圖會加總陣列裡的每個數字當作分母,去計算百分比。
pie([5 5 5]);
關閉視窗
開啟的圖片視窗可以用 close 指令去關閉
close[2];
//代表關閉視窗2

close all
//代表關閉所有視窗
讀取圖檔
imread("檔案名");
//這樣會把數字都從 command window 倒出來,這是錯的。
//我們應該做的是,assign the output of imread into a variable instead of pouring it on the screen. We should use the assignment statement like this.

pretty_picture = imread("檔案名");
// 如果你上面這一句忘記加上分號,就一樣會讀出一堆數字
image("檔案名")
// 會顯示出圖片
座標消失
axis off
//座標會消失
到 16:09 https://www.coursera.org/learn/matlab/lecture/783XR/plotting